Introduction
The Call Volumes report gives you a complete picture of your call volumes organised by site, group or user. It provides a clear, graphical and tabular representation of your outbound, answered and abandoned calls, broken down into hourly time slots. Internal and external calls are itemised separately and every value can be toggled between a percentage or a number. Additionally, all of the displayed values are shown as hyperlinks, allowing you to drill down further into the results.
Running the report
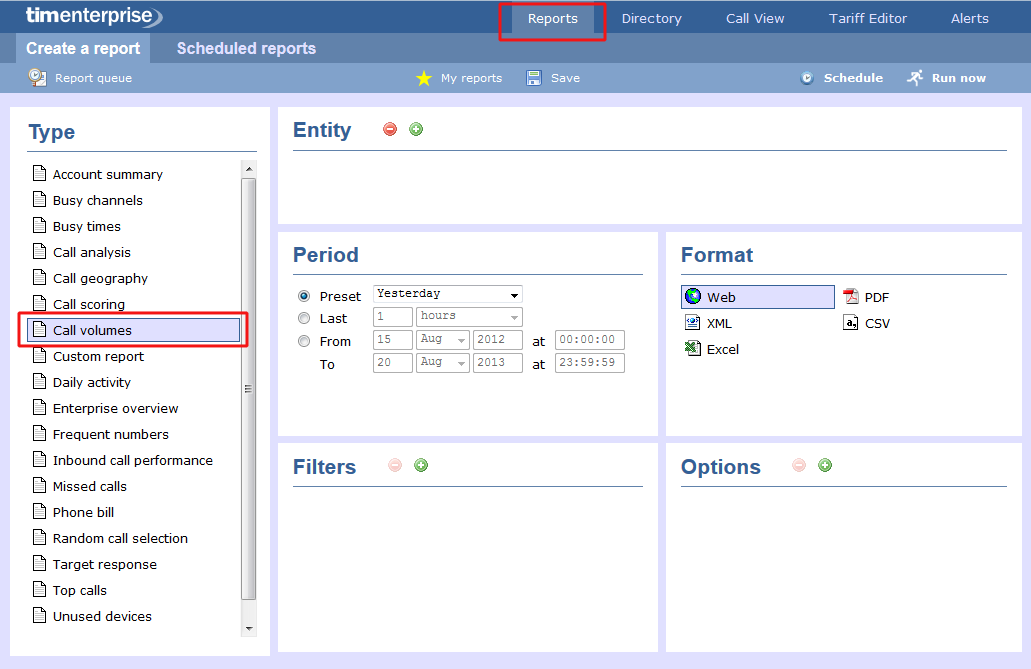
Click on the Reports tab and select Call volumes from the left-hand pane. The screen displaying the parameters of the report will appear, where you can configure the entity, period, filters, options and format of the report.
For details about how to configure these parameters, refer to the relevant page in the list below:
Creating the report
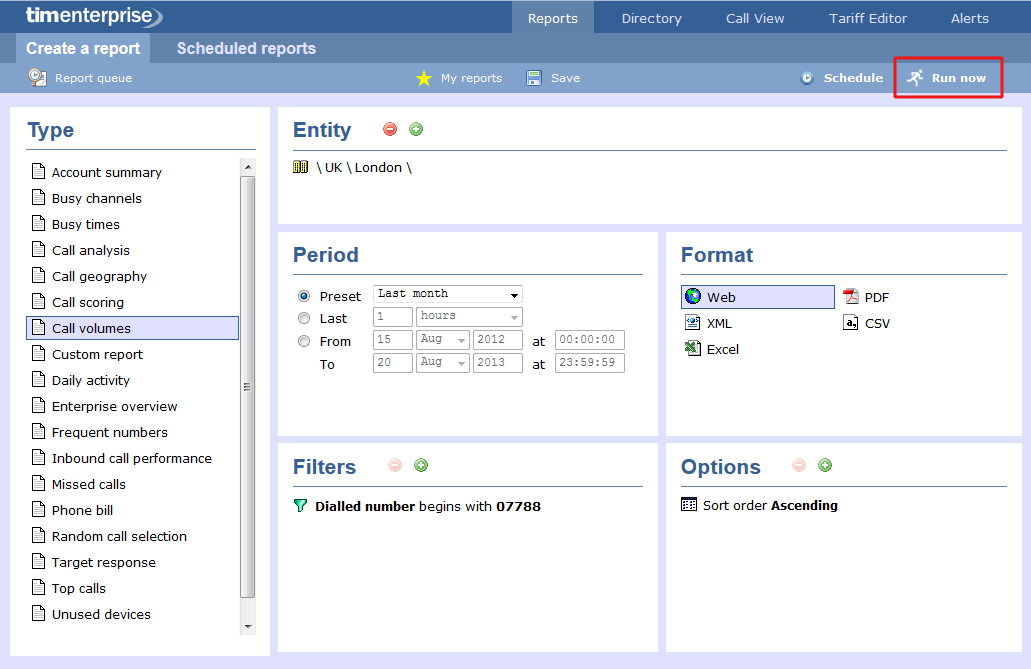
When you have configured the report's parameters, click on the button to run the report immediately; alternatively, you can save the report's definition or schedule the report for future delivery.
The report's results
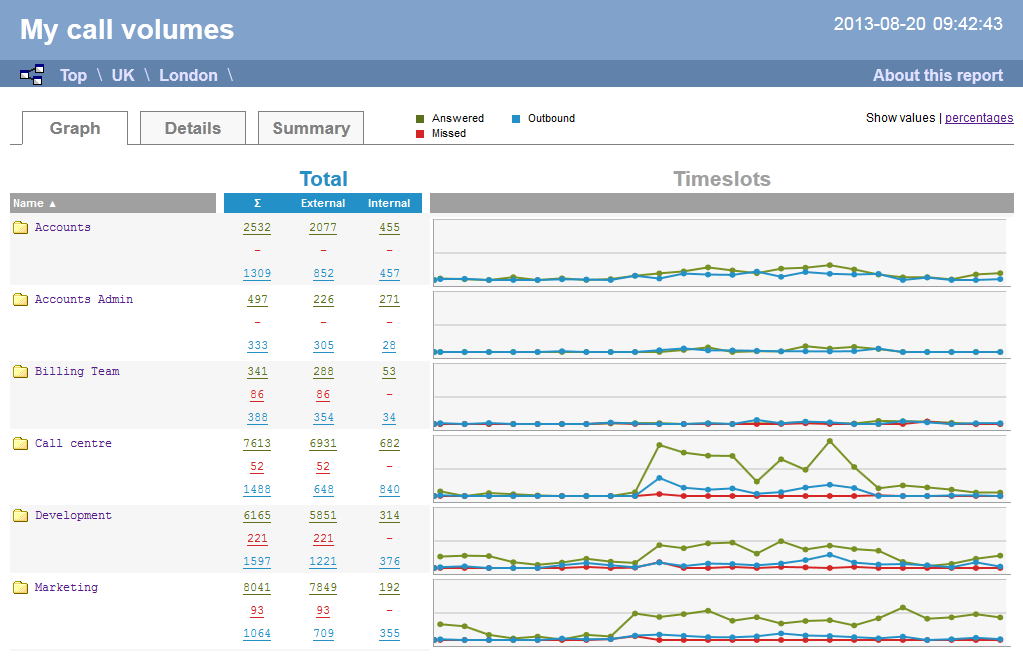
Below is an example of this report's output in Web format:

As with all reports produced by TIM Enterprise, each page of the report includes the following information:
- the report's title
- the date and time that the report was generated
- the name of the report, if applicable
The Web format is the most interactive of all formats: all column headers are click-sortable and most graphical and tabular elements can be drilled down into, allowing deeper analysis of your results. To view details of any filters or parameters used in creating this report, click on About this report at the top-right corner of the page.
The report is divided into three sections: Graph, Details and Summary.
Graph
The Graph tab provides a visual representation of all inbound, outbound and missed calls for both external and internal call activity. A simple toggle button at the top right of the screen enables you to flip between call volumes and percentages.

Details
The Details tab shows the actual volumes (or percentages) of calls for each time slot throughout the day.
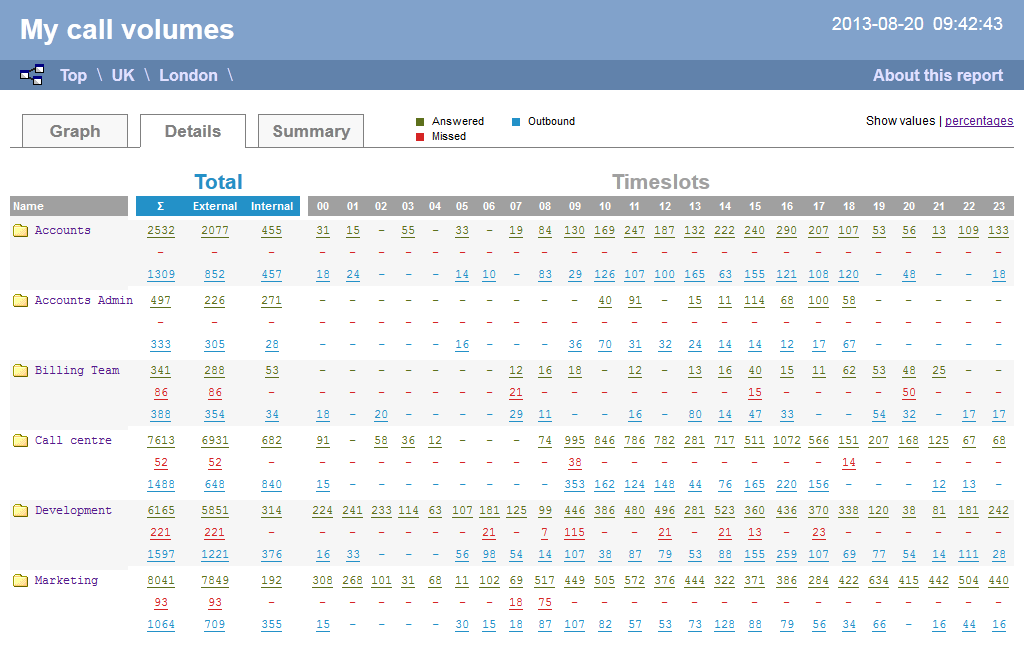
All numeric figures are shown as hyperlinks, allowing you to drill down into an itemised list of the calls that they represent.
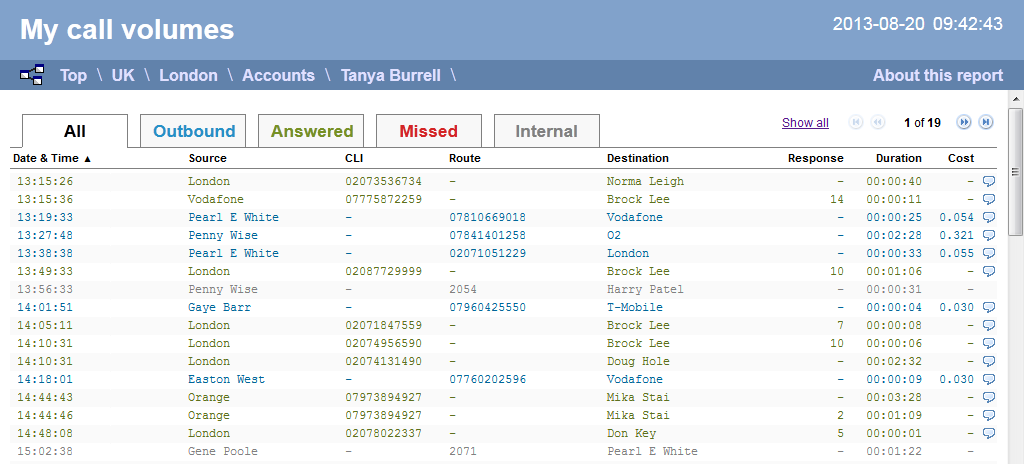
Below is a description of each table header:
| Header | Description |
|---|---|
| Date & Time | The date and time the call started. |
| Source | The place from where the call originated. |
| CLI | The telephone number of the remote caller for inbound calls. |
| Route | The information displayed in this field is determined by the type of call:
|
| Destination | The information displayed in this field is determined by the type of call:
|
| Response | The length of time it took for the call to be answered (i.e. the response time) |
| Duration | The duration of the call (in hours, minutes and seconds) |
| Cost | The cost of the call. |
Summary
The Summary tab shows a summary of all call activity for the reporting period you selected.

To modify your report to cover a larger organisational scope, click on an element of the breadcrumb as shown below:
